
Landed Cost Calculation for Importers: Practical Method

Landed cost is the total price to get an imported product from a foreign supplier’s dock to your U.S. warehouse, including every freight charge, customs duty, federal fee, and destination-side expense along the way. The shipment-level formula is straightforward:
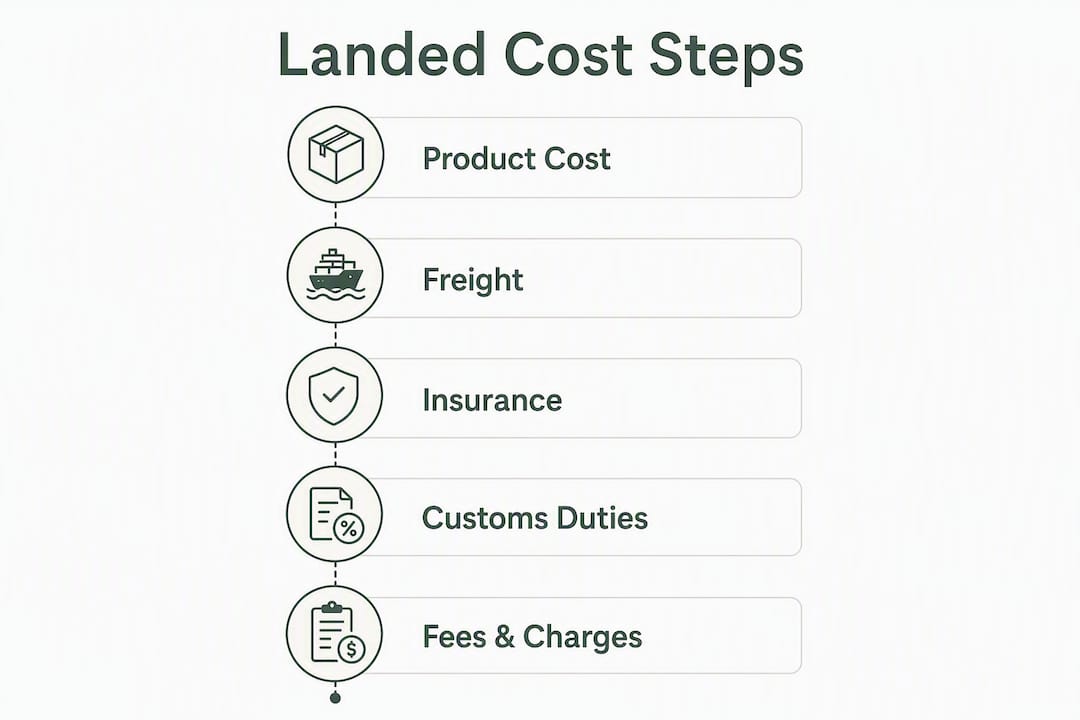
Landed Cost = Product Cost + International Freight + Insurance + Customs Duties + MPF + HMF (ocean only) + Customs Broker Fees + Drayage + Inland Transport + Warehousing + Packaging/FBA Prep + Other Fees

Per-unit landed cost is simply: Total Landed Cost ÷ Units in Shipment.
Three terms importers routinely confuse:
- FOB (Free on Board): Seller’s responsibility ends when goods are loaded onto the vessel at origin. that make up the bulk of your landed cost.
- Landed cost: Every expense from factory gate to your U.S. warehouse door, including duties, federal fees, and last-mile delivery.
- COGS (Cost of Goods Sold): An accounting figure that incorporates landed cost into inventory valuation once goods are received and sold.
Importers who price off the FOB quote alone routinely underestimate their true cost by 10,20%, which is enough to flip a profitable SKU into a money-loser before a single unit ships.
Table of Contents
- What goes into a landed cost calculation?
- How to calculate landed cost step by step
- Worked example: ocean FCL shipment, 500 units
- Hidden costs and common mistakes that spike your landed cost
- Which tools help you calculate and verify landed costs?
- Key Takeaways
- The part most importers get wrong , and it is not the math
- How Beanhawk helps Amazon sellers close the gap between landed cost and actual margin
- Useful sources
What goes into a landed cost calculation?
Every cost component falls into one of three zones: origin, transit, or destination. The table below maps each component to who typically pays it and what drives its variability.
| Component | Description | Typical Payer | Cost Shape |
|---|---|---|---|
| Product cost (EXW/FOB) | Supplier invoice price at origin | Importer | Fixed per PO |
| International freight | Ocean FCL/LCL or air cargo | Importer | Per container, per kg, or per CBM |
| Cargo insurance | Coverage against loss/damage in transit | Importer | , |
| Customs duties (MFN + overlays) | Ad valorem rate on dutiable value; may stack Section 301, Section 232, AD/CVD | Importer | % of customs value; varies by HTS |
| Merchandise Processing Fee (MPF) | Per-entry U.S. fee on most commercial imports; has a per-entry cap | Importer | % of customs value, capped per entry |
| Harbor Maintenance Fee (HMF) | Ocean shipments only; assessed on cargo value | Importer | % of cargo value |
| Customs broker fee | Entry preparation, classification, filing | Importer | Flat fee per entry |
| ISF filing fee | Importer Security Filing (ocean only) | Importer | Flat fee per filing |
| Customs bond | Continuous or single-entry bond | Importer | Annual or per-entry flat fee |
| Terminal handling / THC | Port charges for moving containers at origin/destination | Varies by Incoterm | Per container |
| Demurrage & detention | Fees for holding containers beyond free time | Importer | Per day; highly variable |
| Drayage | Truck move from port to warehouse | Importer | Per mile/container |
| Inland transport | Delivery from port area to final warehouse | Importer | Per shipment |
| Warehousing | Storage at destination before sale | Importer | Per pallet/day or monthly |
| Packaging / FBA prep | Labeling, poly-bagging, carton prep for Amazon inbound | Importer | Per unit or per carton |
| Customs inspection fees | Exam fees when CBP selects a shipment for physical or X-ray exam | Importer | Flat fee per exam |
| Returns reserve | Estimated cost of returns and restocking | Importer | % of revenue (budget line) |
Incoterms matter here. Under EXW, the importer pays everything from the factory door. Under DDP, the supplier quotes a price that theoretically covers duties and delivery, but you lose visibility into what each component actually costs, which makes margin analysis nearly impossible.
How to calculate landed cost step by step
The calculation has five stages. Work through them in order and you will not miss a component.
-
Collect your inputs. Gather the supplier invoice (note the Incoterm), freight agent quote, insurance certificate or rate, HTS code for each SKU, duty rate from the USITC HTS search, customs broker estimate, domestic drayage and delivery quote, packaging/FBA prep cost per unit, and total unit count with dimensions and weights.
-
Determine the dutiable customs value. U.S. Customs assesses duty on transaction value, which is the price actually paid or payable for the goods. If your invoice is on CIF or CFR terms, subtract the international freight and insurance from the invoice total to arrive at the correct FOB-equivalent dutiable base. Getting this wrong leads to overpaying duty on every entry.
-
Calculate duties and federal fees. Apply the MFN (base) duty rate to the customs value. Then layer any applicable overlays: Section 301 tariffs, Section 232 tariffs, or AD/CVD orders. Model each overlay separately rather than assuming a single rate, because tariff stacking can multiply duty exposure rapidly. Add MPF (percentage of customs value, subject to the per-entry cap) and HMF if the shipment moves by ocean.
-
Sum all destination-side charges. Add customs broker fees, ISF filing, bond cost, terminal handling, drayage, inland transport, warehousing, and packaging/FBA prep. Include a contingency line for demurrage, detention, and inspection fees , these are variable but real.
-
Divide by units for per-unit landed cost. Once you have the shipment total, divide by the number of sellable units. For mixed-SKU shipments, allocate freight and other weight/volume-driven charges by dimensional weight rather than simple unit count. Allocating by unit count can hide unprofitable SKUs when SKUs vary significantly in size or density.
Spreadsheet template columns to build
Copy these columns into your landed-cost spreadsheet:
supplier_unit_cost | quantity | total_product_cost | international_freight_total | insurance_total | customs_value | duty_rate_MFN | duty_rate_overlay | duty_amount_total | MPF | HMF | customs_broker_fee | ISF_fee | bond_cost | drayage | inland_transport | warehousing | packaging_prep | contingency | total_landed_cost | landed_cost_per_unit
Allocation note: for freight, insurance, and weight-based fees, divide each charge by total shipment weight (or CBM) and multiply by each SKU’s proportional weight or volume. For flat fees like broker charges, divide by total units or allocate by value.
Pro Tip: Build a separate “tariff overlay” tab that lists every active duty layer for each HTS code. Rates change , Section 301 lists have been revised multiple times, and Section 232 adjustments continue into 2026. A tab you update quarterly prevents a stale rate from quietly eroding your margin.
Worked example: ocean FCL shipment, 500 units
This example uses a fictional consumer goods import from China via ocean FCL to illustrate the full calculation. All figures are illustrative for demonstration purposes.
| Line Item | Amount |
|---|---|
| FOB product cost (500 units × $18.00) | $9,000 |
| International ocean freight (FCL) | $1,800 |
| Cargo insurance | $43 |
| Customs value (FOB basis) | $9,000 |
| MFN duty rate (10% of customs value) | $900 |
| Section 301 tariff overlay (25% of customs value) | $2,250 |
| Total duty | $3,150 |
| MPF (illustrative) | $31 |
| HMF (illustrative) | $11 |
| Customs broker fee | $175 |
| ISF filing fee | $50 |
| Customs bond (single-entry, illustrative) | $60 |
| Drayage (port to warehouse) | $350 |
| Inland transport | $200 |
| Packaging / FBA prep | $250 |
| Contingency (demurrage/inspection reserve) | $150 |
| Landed cost per unit | $32.54 |
The FOB unit cost was $18.00. The true landed cost per unit is $32.54 , an 81% increase over the supplier’s quote. A seller who priced their product using only the FOB figure and a rough freight estimate would have left out $14.54 per unit in real costs. At a $35.00 retail price, that is the difference between a 49% gross margin and a margin of roughly 7%.
This is precisely the dynamic that retail operators frequently underestimate by 10,20% when they budget only for supplier price plus simple freight. The Section 301 overlay alone added $2,250 to a $9,000 product cost , a 25-point duty layer that disappears entirely from a FOB-only model.

Hidden costs and common mistakes that spike your landed cost
Destination-side charges are where most import budgets break down. Demurrage, detention, and port storage are variable and frequently drive unexpected cost spikes tied to port congestion and documentation delays. A single missed appointment at the terminal can trigger per-day detention fees that accumulate faster than most importers expect.
The most common mistakes, and how to address each:
- Pricing off the FOB quote. The supplier’s FOB price covers nothing past the origin port. Build your landed cost model before committing to a purchase order, not after.
- Misclassifying the HTS code. An incorrect classification can mean the wrong duty rate, missed AD/CVD exposure, or a CBP exam. Verify the 10-digit HTS code against the USITC tariff schedule before placing an order.
- Ignoring duty layering. MFN rates, Section 301 tariffs, Section 232 tariffs, and AD/CVD orders can all apply to the same shipment. Model each overlay separately.
- Flat-fee MPF assumptions. MPF has a per-entry cap, which means consolidating multiple smaller shipments into one entry can reduce total MPF paid. Run the math before splitting shipments.
- Excluding demurrage and detention. These are not rare edge cases. Port congestion, documentation errors, and customs exams all trigger them. Build a per-shipment contingency line.
- CIF invoice, wrong duty base. If your supplier invoices on CIF terms, the freight and insurance are embedded in the price. Strip them out before applying the duty rate , otherwise you overpay on every entry.
Pro Tip: Set a calendar reminder to check active Section 301 and Section 232 notices every quarter. The USTR and Commerce Department publish updates, and a rate change mid-year can shift your landed cost model significantly without any change to your supplier price.
For Amazon FBA sellers, the cost picture extends further. FBA prep, inbound shipping to Amazon fulfillment centers, and potential lost or damaged inventory during inbound all affect the true per-unit economics. Beanhawk’s continuous inbound and FBA ledger monitoring surfaces these charges automatically, so misposted or unrecovered costs do not quietly erode the margin you calculated at the landed-cost stage.
Which tools help you calculate and verify landed costs?
Getting the duty rate right is as important as the arithmetic. These are the primary sources and tools for U.S. importers:
- USITC HTS Search: The authoritative source for 10-digit HTS classifications and MFN duty rates. Search by product description or code. Always verify the effective date , rates change with each tariff action.
- U.S. Customs and Border Protection (CBP): CBP’s guidance pages cover customs valuation methodology, transaction value rules, and how to handle CIF/CFR invoices. Use this to confirm your duty base calculation.
- FreightFigures Landed Cost Calculator: Lets you enter freight mode, cargo value, HTS code, and origin country to generate a component-level cost estimate. Useful for scenario modeling across ocean FCL, LCL, and air freight ($4,$8 per kilogram for standard cargo).
- Tariffstool Playbook: Walks through component formulas and worked examples. Useful as a cross-check against your own spreadsheet, but adapt the ranges to your specific HTS and origin.
- Freightos: Provides freight rate quotes and landed-cost resources that let you compare ocean and air scenarios with live market rates.
- DHL landed-cost resources: DHL’s import guides cover destination-country fee structures and documentation requirements, useful when verifying destination charges for multi-country sourcing.
For AD/CVD coverage and active Section 301 or Section 232 notices, check the USTR website and the Commerce Department’s International Trade Administration directly. These are the primary sources for overlay rates and their effective dates , no calculator substitutes for verifying the current notice.
Key Takeaways
Accurate landed cost calculation requires modeling every cost layer before committing to a purchase order, not after goods arrive at the port.
| Point | Details |
|---|---|
| Use the full formula | Landed cost = product cost + freight + insurance + duties (all layers) + MPF + HMF + broker fees + drayage + prep + contingency. |
| Strip CIF before applying duty | If your invoice is on CIF terms, subtract freight and insurance before calculating the dutiable customs value. |
| Model tariff overlays separately | MFN, Section 301, Section 232, and AD/CVD can all stack on the same shipment , a single assumed rate will understate your duty exposure. |
| Allocate freight by volume or weight | For mixed-SKU shipments, dimensional-weight allocation reveals true per-SKU costs; unit-count allocation hides unprofitable lines. |
| Beanhawk for FBA reconciliation | Beanhawk monitors inbound shipments and FBA ledger events continuously, surfacing misposted charges that erode the margin you calculated at the landed-cost stage. |
The part most importers get wrong , and it is not the math
The arithmetic in a landed cost calculation is not complicated. What trips up experienced importers is the assumption that the cost picture is stable once they have run the numbers once.
Tariff overlays change. Section 301 lists have been revised repeatedly, and the pace of trade-policy action in 2026 means a duty rate that was accurate in January may not be accurate in July. Most teams build a landed-cost model at the sourcing stage and do not revisit it until a shipment clears and the broker invoice arrives with a number they did not expect.
The second failure point is destination-side charges. Demurrage and detention are not line items most buyers think about when they are negotiating a supplier price. By the time a container sits at the port for five extra days because of a documentation error, the per-unit cost has moved in ways that no spreadsheet template anticipated.
The fix is operational, not mathematical: build a quarterly tariff review into your sourcing calendar, keep a contingency line in every landed-cost model, and treat the first shipment from a new supplier as a calibration run. The numbers from that first entry , actual broker invoice, actual drayage, actual exam fees if any , become the baseline for every subsequent model.
For Amazon sellers, the reconciliation step matters just as much as the initial calculation. Inbound shipments that arrive short, damaged, or misprocessed by Amazon create a gap between the landed cost you recorded and the inventory value Amazon actually credits. That gap is recoverable, but only if someone is watching the FBA ledger closely enough to catch it.
How Beanhawk helps Amazon sellers close the gap between landed cost and actual margin
Every dollar you spend getting inventory to a U.S. warehouse is only worth what Amazon actually receives and credits. Beanhawk monitors your inbound shipments and FBA ledger events continuously, catching discrepancies between what you shipped and what Amazon logged , before those gaps compound across multiple purchase orders.
Where most sellers lose money is not in the landed-cost spreadsheet but rather in gaps that tools like TaxBench , Upload Bank CSV, Get BAS & Tax Summary | Australia can help reconcile in bookkeeping workflows. It is in the space between “goods received at Amazon” and “inventory credited correctly.” Beanhawk automates the reconciliation of those events and posts settlements directly to QuickBooks or Xero, so your COGS and landed-cost entries stay accurate without manual ledger work. There are no hidden fees or commissions , just a subscription that pays for itself when the first recovered reimbursement posts.
If you sell on Amazon FBA and have not audited your inbound shipment discrepancies recently, find out whether Amazon owes you money with a free audit. It takes minutes to connect, and the results are often surprising.
Useful sources
Primary U.S. sources to verify duties, fees, and calculation methodology:
- USITC HTS Search: Official 10-digit HTS classifications and MFN duty rates for all U.S. imports. Always check the effective date before finalizing a model.
- U.S. Customs and Border Protection , Customs Value Guidance: CBP’s authoritative guidance on transaction value, CIF/CFR handling, and dutiable value determination.
- FreightFigures Landed Cost Calculator: Scenario modeling for ocean and air freight with component-level cost breakdowns.
- Tariffstool Landed Cost Playbook: Component formulas and worked examples for cross-checking your own spreadsheet.
- DripCapital , Landed Cost Guide: Practitioner-level breakdown of components, common underestimation patterns, and allocation methods.
For binding tariff classification rulings, AD/CVD coverage questions, or shipments subject to regulated agency review (FDA, EPA, CPSC), consult a licensed customs broker. A broker’s binding ruling request through CBP is the only way to get a legally definitive classification , no online tool substitutes for that when the stakes are high.