
SKU Profitability Analysis for Amazon Sellers: Calculate, Rank, Act

SKU profitability analysis measures the true net profit of each individual product after every cost is accounted for, including landed COGS, fulfillment, marketplace fees, advertising, and returns. The core formula is straightforward: Net SKU Profit = Revenue per unit minus all direct and allocated costs per unit. Start this week by pulling your top 20 SKUs and calculating contribution margin per unit for each. That single exercise will almost certainly surface one or two products you thought were profitable that are quietly draining cash.
Research across 50 ecommerce brands found that 62% of SKUs were unprofitable once all variable costs were properly allocated, and the top 25% of SKUs generated roughly 85% of total contribution margin. That concentration is the whole point of the analysis: most of your catalog is a distraction, and a handful of products are carrying the business.
Your immediate action: Compute contribution margin per unit (Revenue minus COGS minus fulfillment minus marketplace fees) for your top 20 SKUs this week. Rank by total contribution dollars, not percentage margin. The results will tell you where to focus every subsequent decision in this guide.
Key Takeaways
Accurate SKU profitability analysis requires fully-loaded costs, a documented allocation method, and a monthly cadence, because a single month of clean data consistently surfaces enough margin recovery to justify the entire effort.
| Point | Details |
|---|---|
| Start with contribution margin | Calculate revenue minus COGS, fulfillment, fees, and return reserve for your top 20 SKUs first. |
| Separate pre- and post-ad profit | Always show contribution before and after advertising to distinguish product economics from media efficiency. |
| Rank by contribution dollars | Sort SKUs by total contribution dollars, not percentage margin, to identify what actually drives profit. |
| Run monthly, decide quarterly | Refresh the model monthly to catch fee and cost drift; make assortment decisions quarterly with full context. |
| Beanhawk cleans your inputs | Beanhawk automates FBA reimbursement recovery and settlement posting to QuickBooks or Xero, so your cost data is accurate before the analysis runs. |
Primary sources and further reading
- SKU-Level Profitability: The Complete Guide , Research-backed guide with the 62%/85% concentration finding and a practical scoring framework.
- Ecommerce SKU Profitability Analysis: Accountant Guide , Accountant-authored walkthrough covering pre- and post-ad reporting standards and governance requirements.
- E-Commerce Profitability by SKU: CFO Engine , CFO-level analysis of fully-loaded cost attribution and how allocation choices affect outcomes.
- Know Your True Margins with SKU-Level Profitability , Practical breakdown of hidden costs (storage, returns, marketplace fees) that flip apparent winners into losers.
- Shopify SKU Profit Analysis: Ecomwith , Step-by-step tutorial on the SKU profit ladder, hero ranking, and order-level sampling methodology.
- Growing by Cutting SKUs at Clorox , Harvard Business Review case study on how portfolio pruning improved overall profitability at a major consumer brand.
Table of Contents
- Why SKU-level profitability matters more than your revenue dashboard
- All the costs that belong in your per-SKU calculation
- The formulas you need, with a worked numeric example
- Where to pull your inputs: reports, systems, and reconciliation pitfalls
- Which tools actually work for SKU-level tracking
- How to score and rank SKUs: metrics, thresholds, and decision tags
- What to do with each SKU after you’ve scored it
- Pricing levers that actually move SKU profitability
- Advanced cost allocation: when simple methods aren’t enough
- Methodology and governance: keeping the analysis repeatable and trusted
- Step-by-step checklist to implement SKU profitability analysis
- How Beanhawk supports SKU-level profitability and reconciliation
- How customer lifetime value changes the SKU profitability equation
- Setting profitability benchmarks and targets by SKU category
- How to account for seasonality and demand variability in your analysis
- What most SKU profitability guides get wrong
- Beanhawk gives you clean numbers before the analysis starts
- Sources
Why SKU-level profitability matters more than your revenue dashboard
Revenue and even category-level gross margin hide the real story. SKU-level profitability peels that apart and answers the questions that actually drive decisions: Which products should get more ad spend? Which should be repriced before the next reorder? Which should be quietly discontinued?
The business outcomes are concrete. Sellers who run regular SKU analysis can redirect ad budgets toward products with room to absorb acquisition costs, renegotiate supplier pricing on high-volume losers, and free up warehouse space from slow-moving inventory that ties up cash without generating contribution.
Who owns this work? Finance owns the model and the numbers. Operations owns the fulfillment and storage cost inputs. Category managers own the assortment decisions that come out of it. Paid media owns the advertising cost inputs and acts on ACoS/CPA findings. In practice, someone in finance or a senior analyst usually builds the model and runs the monthly operational review, while a quarterly strategic session pulls in all four stakeholders.
Cadence matters. A monthly operational review catches pricing drift, fee changes, and return-rate spikes before they compound. A quarterly strategic review is the right moment to make assortment calls: scale, reprice, bundle, or delist. An annual deep-dive is where you revisit allocation methodology and recalibrate benchmarks.
Pro Tip: Set a calendar reminder for the first week of each month to refresh your SKU model with the prior month’s settlement data. Decisions made on 90-day-old numbers are often wrong by the time they’re implemented.
All the costs that belong in your per-SKU calculation
The most common reason a SKU analysis produces misleading results is an incomplete cost stack. Hidden expenses like marketplace fees, dimensional-weight shipping, storage fees, and return handling routinely flip high-revenue SKUs into unprofitable ones the moment they’re attributed at the product level.
Here is the complete cost checklist, organized by type:
Directly attributable costs (assign per unit):
- Landed COGS: product cost plus inbound freight, duties, and customs clearance
- Pick and pack labor (if 3PL or in-house warehouse)
- Outbound shipping (carrier cost per shipment, dimensional weight where applicable)
- Marketplace referral fees (Amazon, Walmart, eBay, Shopify transaction fees)
- Payment processing fees (typically 2,3% of gross revenue)
- FBA fulfillment fees (per-unit, size-tier dependent)
- Returns and reverse logistics: return shipping, restocking labor, refurbishment, and disposal
Costs requiring allocation:
- FBA storage fees: allocate by cubic volume times average dwell time per SKU
- Shared 3PL storage: allocate by pallet positions or cubic feet occupied
- Advertising spend (ACoS/CPA): attribute to the SKU the ad drove, not the account
- Promotions and discounts: deduct the actual discount amount per unit sold under promotion
- Chargebacks and payment disputes: allocate by order-level data
- Warranty and customer support costs: allocate by SKU-specific ticket volume or return rate
Allocation rules that hold up under audit:
| Cost Type | Allocation Driver | Notes |
|---|---|---|
| Storage fees | Cubic volume × dwell time | Pull from FBA inventory age report |
| Shared freight | Weight or volume per shipment | Use actual carrier manifests |
| Returns | SKU-specific return rate | Match refunds to original order SKU |
| Advertising | Direct attribution per SKU | Use ad platform SKU-level reports |
| Shared headcount | Pick/pack time study per SKU | Estimate from 3PL invoices or time logs |
| Chargebacks | Order-level match | Pull from payment processor dispute reports |
Pro Tip: For returns, use a reserve approach: calculate your trailing 90-day return rate per SKU and apply it as a per-unit cost reserve. This smooths volatility and gives you a realistic cost even before returns are fully processed. Reconcile the reserve against actual returns quarterly.
Fully-loaded SKU profitability requires a documented cost-attribution method because the choice of allocation driver materially changes which SKUs look profitable. Document your method once, apply it consistently, and flag any estimated cells in your model.
The formulas you need, with a worked numeric example
Four metrics form the backbone of any SKU profitability model. Here’s how they build on each other:
Contribution Margin per unit = Revenue per unit minus variable costs (COGS, fulfillment, marketplace fees, shipping, returns reserve)
Contribution Margin % = (Contribution Margin per unit ÷ Revenue per unit) × 100
Post-Advertising Gross Profit (PAG) = Contribution Margin per unit minus advertising cost per unit (CPA)
Net SKU Profit per unit = PAG minus allocated overhead per unit (storage, chargebacks, support)
A reliable SKU analysis shows gross profit, contribution before advertising, and contribution after advertising, and matches units sold to the correct landed inventory cost. Presenting both pre- and post-ad profitability is critical because it separates product economics from acquisition strategy. A SKU with a strong pre-ad contribution but a negative PAG is a product problem only if the CPA is unavoidable; it’s a media problem if the ad spend is inefficient.
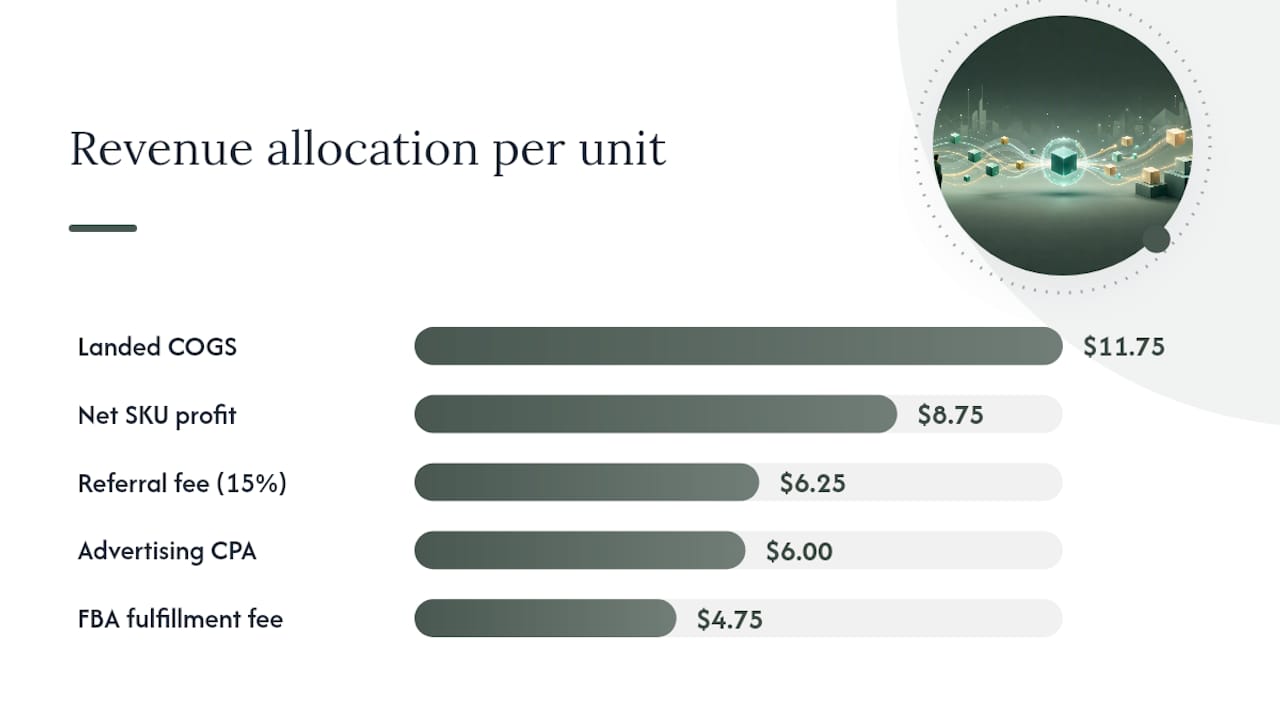
Worked example: Widget Pro (1 unit sold on Amazon FBA)
| Line Item | Amount |
|---|---|
| Gross revenue | $41.00 |
| Amazon referral fee (15%) | ($6.25) |
| FBA fulfillment fee | ($4.75) |
| Landed COGS | ($11.75) |
| Return reserve (8% × $41) | ($3.30) |
| Contribution Margin | $15.80 |
| Contribution Margin % | 37.7% |
| Advertising CPA | ($6.00) |
| Post-Advertising Gross Profit (PAG) | $9.80 |
| Storage allocation | ($0.75) |
| Chargeback allocation | ($0.25) |
| Net SKU Profit per unit | $8.75 |
| Net SKU Profit % | 20.9% |
For a quick sanity check on your FBA fee inputs, Beanhawk’s FBA fee calculator lets you verify size-tier fees before building them into the model.
The single most common spreadsheet mistake: Pulling revenue from bank deposits instead of gross settlement revenue. Bank deposits are net of Amazon’s deductions, so using them as your revenue line double-counts fees and understates true gross margin. Always start from gross settlement revenue, then deduct fees as explicit line items. Your settlement report is the source of truth, not your bank statement.
Suggested spreadsheet columns (one row per SKU per period): SKU | ASIN | Period | Units Sold | Gross Revenue | Referral Fee | FBA Fee | Landed COGS | Return Reserve | Contribution Margin | Contribution % | Ad Spend | CPA | PAG | PAG % | Storage | Other Overhead | Net SKU Profit | Net SKU Profit %
For Amazon-specific margin calculations, Beanhawk’s Amazon profit margin guide walks through the fee stack in detail.
Where to pull your inputs: reports, systems, and reconciliation pitfalls
Every number in your SKU model has a specific source. Knowing where to pull each one eliminates the guesswork that turns a good model into an unreliable one. Mapping each required input to a specific report or system reduces reconciliation errors significantly.
| SKU Input | Source Report / System | Reconciliation Notes |
|---|---|---|
| Gross revenue per SKU | Amazon Settlement Report | Use “order” type rows; exclude “other” adjustments |
| Referral fees | Amazon Settlement Report | Match to order ID; verify fee tier per ASIN |
| FBA fulfillment fees | FBA Fee Preview / Settlement | Cross-check against size-tier changes quarterly |
| Landed COGS | Purchase orders + freight invoices | Allocate freight by weight or volume per unit |
| Advertising spend | Amazon Ads console (SKU-level export) | Use attributed spend, not account-level totals |
| Returns and refunds | FBA Returns Report + Settlement | Match refund to original order SKU; check restocking fees |
| Storage fees | FBA Inventory Age Report | Allocate long-term storage fees to aged SKUs specifically |
| Payment processing fees | Payment processor statement | Applies to non-Amazon channels (Shopify, DTC) |
| 3PL pick/pack and storage | 3PL invoice | Request SKU-level line items; estimate if bundled |
| ACoS / ROAS | Ad platform exports (Amazon, Meta, Google) | Use SKU-level attribution, not campaign-level averages |
Common reconciliation pitfalls to watch for:
- Timing differences: Amazon settles every two weeks. Your ad spend accrues daily. Match both to the same period before comparing.
- FBA reimbursements not posted: Amazon issues reimbursements for lost or damaged inventory, but they appear as separate line items in the settlement. If your accounting system doesn’t capture them, your COGS looks higher than it is.
- Negative adjustments in settlements: Chargebacks, fee corrections, and promotional credits all appear as negative rows. Missing them inflates apparent revenue.
- Bank deposits vs. gross revenue: Covered in the formula section above, but worth repeating: your bank deposit is net of all Amazon deductions. Never use it as a revenue input.
- FNSKU-to-SKU mapping errors: Amazon tracks inventory by FNSKU, not your internal SKU. If your mapping table is stale, costs get attributed to the wrong product.
Understanding ASIN-to-SKU mapping is equally important when reconciling multi-variant listings, where a single ASIN can map to several internal SKUs.
Which tools actually work for SKU-level tracking
The right tool depends on catalog size, channel mix, and how much manual reconciliation your team can absorb. Here’s how the categories stack up:
Spreadsheets (Google Sheets, Excel) are the right starting point for catalogs under 100 SKUs. You control every formula, the audit trail is visible, and setup takes a weekend. The ceiling is real, though: manual data pulls from Amazon settlements, ad exports, and 3PL invoices become a full-time job above a few hundred SKUs.
BI platforms (Looker, Tableau, Power BI) give you visualization and drill-down capability, but they require clean, structured data inputs. They don’t reconcile your settlement reports or map FBA fees to SKUs. They’re a reporting layer, not a data-collection layer.
Ecommerce analytics platforms often provide revenue and order-level data but rarely include landed cost, 3PL fees, or advertising attribution at the SKU level. Check carefully before assuming the margin number they show is fully loaded.
Accounting integrations (QuickBooks, Xero with ecommerce connectors) get you closer to accurate COGS if your purchase orders and inventory valuation are set up correctly. The gap is usually on the fee and advertising side: most accounting setups don’t automatically pull Amazon referral fees or ad spend at the SKU level.
Reimbursement and settlement automation tools like Beanhawk sit at the intersection of reconciliation and accounting. They continuously monitor FBA ledger events, catch under-reimbursed inventory, and post settlements automatically to QuickBooks or Xero. For sellers running SKU profitability analysis, the value is that your cost inputs are accurate from the start rather than manually patched.
Must-have features when evaluating any tool:
- SKU-level cost attribution (not just order-level or account-level)
- Multi-channel reconciliation (Amazon, Shopify, Walmart, eBay)
- Automated ingestion of platform fees and ad-platform data
- Integration with QuickBooks or Xero
- Exportable margin reports by SKU and period
- Audit trail showing where each number came from
Beanhawk’s fee calculators are a free starting point for sanity-checking FBA and Shopify fee inputs before you build them into a full model.
Pro Tip: Before committing to any analytics platform, ask the vendor to show you a SKU-level P&L that includes advertising cost and returns. If they can’t produce that view, the tool won’t support the analysis you need.
Manual SKU profit work becomes impractical at scale; integrating sales channels and accounting systems is necessary to maintain accurate SKU-level profit as order volume grows.
How to score and rank SKUs: metrics, thresholds, and decision tags
The goal of scoring is to convert a spreadsheet of numbers into a short list of decisions. Use these six metrics in combination:
-
Contribution dollars (absolute): Total contribution margin generated in the period. This is your scale metric. A SKU with a 15% margin but $50,000 in monthly contribution outranks a 40% margin SKU generating $2,000.
-
Contribution margin % (efficiency): Tells you how much room the product has to absorb cost increases or ad spend. Below 20% on Amazon FBA, most SKUs have little buffer.
-
Inventory turnover / days of inventory: How fast the SKU sells relative to stock on hand. High turnover with strong contribution is the ideal combination. High turnover with thin margins is a cash trap.
-
ACoS / CPA: Advertising cost of sale or cost per acquisition. A SKU with a PAG of $8 and a CPA of $9 is losing money on every ad-driven sale. Compare CPA to PAG, not to revenue.
-
Return rate: SKUs with return rates above 10,15% (category-dependent) often have product-fit or listing-accuracy problems. High return rates destroy contribution even when the base margin looks fine.
-
Margin volatility: A SKU whose contribution swings 30% month to month is harder to plan around than one with stable margins. Flag high-volatility SKUs for root-cause investigation before scaling.
Scoring matrix and decision tags:
A practical SKU profit ladder uses sample order-level checks to validate inputs like refund reserves, fulfillment cost, and current CPA before assigning a decision tag. Pull the latest 20 orders per SKU to verify your model inputs before finalizing the score.
| Decision Tag | Criteria | First Move |
|---|---|---|
| Hero | Top 25% contribution dollars, PAG > 15%, stable return rate | Scale ad spend; protect inventory position |
| Maintain | Positive PAG, contribution % 15,25%, moderate turnover | Hold current strategy; monitor monthly |
| Observe | Thin PAG (5,15%), high return rate, or margin volatility | Investigate root cause; run 60-day test |
| Delist | Negative PAG or negative net profit, low turnover | Stop ads; liquidate or bundle; discontinue |
Weight contribution dollars heavily when ranking. A “Maintain” SKU generating $30,000 monthly contribution deserves more attention than a “Hero” SKU generating $3,000, even if the percentage margin is lower.
What to do with each SKU after you’ve scored it
Scores are only useful if they drive action. Here’s the playbook by decision tag:
Hero SKUs: Protect supply chain continuity first. A stockout on your top contributor is the most expensive mistake in ecommerce. Increase reorder points, negotiate safety stock with your supplier, and consider pre-positioning inventory ahead of peak seasons. Then increase ad spend carefully, monitoring that CPA stays below PAG as you scale.

Maintain SKUs: These are your stable base. The main risk is drift: a fee increase, a supplier price bump, or a return-rate creep that erodes contribution without triggering an alert. Set margin floor alerts in your model (flag any SKU whose contribution % drops more than 5 percentage points month over month).
Observe SKUs: Run a 60-day controlled test before making a permanent decision. For a high-return-rate SKU, improve the listing, add size guides, or update packaging before concluding the product is unfixable. For a thin-margin SKU, test a $2,$3 price increase and measure the impact on conversion and contribution. SKU rationalization and cutting slow or loss-making SKUs can materially improve margins, but only after you’ve ruled out operational fixes.
Delist SKUs: Stop advertising immediately. Then choose a path: liquidate via promotions or wholesale channels, bundle with a Hero SKU to move remaining inventory, or simply discontinue. The cash recovered from liquidation often funds a better-performing reorder.
Risk notes by action:
- Delisting a SKU that has strong reviews can hurt your listing’s organic rank for related products.
- Bundling low-margin SKUs with Hero SKUs can dilute the Hero’s perceived value if done carelessly.
- Repricing above market without a differentiation story usually accelerates the decline of Observe SKUs.
Pro Tip: Before delisting, check whether the SKU’s poor performance is channel-specific. A product losing money on Amazon FBA might be profitable on your DTC Shopify store where referral fees don’t apply. Run channel-specific SKU profit before pulling the plug entirely.
Pricing levers that actually move SKU profitability
Pricing is the fastest lever to pull, but it is also the easiest to misuse. The goal is to improve net SKU profit, not just revenue, so every pricing test needs a contribution metric as its success measure.
Price increases are underused by most Amazon sellers. Test price increases on Observe SKUs with thin margins before testing on Heroes, where a conversion drop carries more volume risk.
Minimum advertised price (MAP) enforcement matters most for brands selling through third-party resellers. MAP violations by resellers suppress your own listing’s price ceiling and compress margins across the channel. Monitor MAP compliance monthly if you have a reseller network.
Promotion control is where most sellers leak contribution without realizing it. Build a promotion profitability check into your approval process: no promotion runs without a post-promo contribution estimate.
Bundling can rescue low-margin SKUs by increasing average order value and reducing per-unit fulfillment cost as a percentage of revenue. The math works when the bundle’s combined contribution exceeds the sum of its parts sold separately.
Dynamic pricing tools can help on high-velocity SKUs where competitive pricing pressure is real. The discipline is to set a floor price based on your minimum acceptable PAG, not just a competitive price match. Never let a repricing algorithm push you below your contribution floor.
Pro Tip: When testing a price increase, run it for at least 30 days before measuring conversion impact. Shorter windows are too noisy, especially on SKUs with weekly demand cycles.
Advanced cost allocation: when simple methods aren’t enough
Simple per-unit or per-revenue allocations work fine for homogeneous catalogs. When your SKUs vary significantly in size, weight, handling complexity, or return behavior, blunt allocations cross-subsidize your losers and make your winners look worse than they are.
When to invest in activity-based costing (ABC):
- Your catalog includes both small, fast-moving items and large, slow-moving ones sharing the same warehouse.
- Storage and handling costs are a significant share of total cost (above 15,20% of revenue).
- You suspect certain SKUs are subsidizing others but can’t prove it with current allocations.
Practical ABC allocation examples:
- Storage: Allocate by cubic volume times average dwell time. A SKU occupying 2 cubic feet for 45 days costs more to store than one occupying 0.5 cubic feet for 10 days, even if both sold the same number of units.
- Returns: Allocate by SKU-specific return rate, not a catalog average. A 25% return rate SKU should absorb 25% of its revenue as a return cost reserve, not the catalog average of 8%.
- Shared headcount: Use pick/pack time studies. If one SKU takes 3 minutes to pack and another takes 45 seconds, a flat per-order allocation misrepresents labor cost by a factor of four.
- Inbound freight: Allocate by weight or volume per unit, not by unit count. A 10-pound item costs more to ship inbound than a 2-ounce item.
Multi-channel complexity: Different marketplaces have materially different economics. Amazon FBA carries fulfillment fees and referral fees. Shopify DTC carries payment processing and outbound shipping but no referral fee. Walmart Marketplace has its own fee structure. Run channel-specific SKU profit models rather than blending channels into a single average, or you’ll make channel-mix decisions based on fiction.
When to stop adding complexity: A model that takes three days to run monthly won’t get run. Validate your allocation choices with sensitivity testing: change your storage allocation driver from unit count to cubic volume and see if the ranking of your top 20 SKUs changes materially. If it doesn’t, the simpler method is good enough. If it does, the more precise driver is worth the effort.
Methodology and governance: keeping the analysis repeatable and trusted
A SKU profitability model that produces different results each month because someone changed an assumption is worse than no model. Governance is what makes the work trustworthy enough to act on.
Operating rules:
- Document every allocation method in a separate “methodology” tab in your spreadsheet or model. Include the driver, the source data, and the date the method was last reviewed.
- Separate pre-ad and post-ad profitability in every report. Treat advertising as a toggle, not a fixed cost embedded in COGS.
- Flag estimated cells in yellow. Any cell where you used an estimate rather than actual data should be visible at a glance.
- Keep an audit trail: save the source files (settlement reports, ad exports, 3PL invoices) that fed each monthly run.
Validation checklist:
- Reconcile total SKU-level revenue to your accounting ledger. If they don’t match within a rounding tolerance, find the gap before publishing results.
- Run order-level spot checks on 10,20 random orders per period. Verify that the fees, COGS, and shipping costs in your model match the actual order data.
- Confirm your inventory valuation method (FIFO, weighted average) is consistent with your accounting system. Mismatches create phantom profit or phantom loss.
Pro Tip: Your SKU profitability report should be decision-ready, not just data-complete. Include a column for “recommended action” and a column for “owner.” A report that ends with a table of numbers and no next steps gets filed and forgotten.
A repeatable management report should disclose the owner, assumptions, estimated versus actual figures, and recommended actions to be genuinely decision-ready.
Step-by-step checklist to implement SKU profitability analysis
This is the ordered sequence to go from zero to a running monthly model. Time estimates assume a catalog of 50,200 SKUs and one analyst.
-
Data discovery (Days 1,3): Identify every cost source: Amazon settlement reports, FBA reports, ad platform exports, 3PL invoices, purchase orders, and freight invoices. Confirm you have access to at least 90 days of history. Map each input to a specific report using the data-source table in this guide.
-
SKU and identifier mapping (Days 2,4): Build a master mapping table: internal SKU, ASIN, FNSKU, and any channel-specific identifiers. This table is the spine of every reconciliation. Errors here cascade through the entire model. Reference Beanhawk’s SKU glossary if you need clarity on identifier types.
-
Sample model build (Days 3,7): Build the spreadsheet model for your top 20 SKUs first. Use the column layout from the formula section above. Pull actual data for one full month. Calculate contribution margin, PAG, and net SKU profit for each.
-
Validation and spot checks (Days 7,10): Pull 20 actual orders per SKU and verify that your model’s per-unit costs match the order-level data. Reconcile total revenue to your accounting ledger. Fix any gaps before expanding.
-
Full catalog expansion (Days 10,20): Extend the model to your full catalog. For low-volume SKUs (fewer than 10 orders in the period), use a trailing 90-day average rather than a single month to reduce noise.
-
First scoring run (Day 20,25): Apply the scoring matrix from the identification section. Assign decision tags. Produce a ranked list sorted by contribution dollars.
-
Stakeholder review and governance setup (Days 25,30): Present findings to finance, operations, and category management. Agree on the monthly cadence, the report owner, and the decision-making process for each tag.
-
Operational handoff (Day 30+): Automate data pulls where possible. Set up alerts for margin floor breaches. Schedule the monthly refresh and the quarterly methodology review.
A practical SKU profit ladder uses order-level sampling to validate inputs before finalizing scores, which is why step 4 comes before full expansion.
Early success signals (first 30,90 days):
- At least one SKU repriced or delisted based on analysis findings within 30 days.
- Ad spend reallocated away from negative-PAG SKUs within 45 days.
- FBA reimbursements identified and claimed within 60 days.
- Monthly model running in under four hours by day 90.
How Beanhawk supports SKU-level profitability and reconciliation
The most time-consuming parts of SKU profitability analysis are data collection and reconciliation, specifically pulling FBA ledger events, matching reimbursements, and posting settlements to your accounting system accurately. Beanhawk automates exactly those tasks.
What Beanhawk does for SKU-level analysis:
- Continuously monitors FBA ledger events and inbound shipments to catch lost, damaged, or under-reimbursed inventory before it disappears from your books.
- Automates reimbursement claims so recoverable amounts are captured and posted, not left on the table.
- Posts settlements automatically to QuickBooks or Xero, with journal entries that preserve SKU-level cost attribution rather than collapsing everything into a single deposit line.
- Tracks landed costs and purchase orders, so your COGS inputs reflect actual landed cost rather than invoice price alone.
- Sends reorder alerts when inventory levels approach thresholds, connecting profitability data to replenishment decisions.
Why this matters for your P&L: When Amazon loses or damages FBA inventory, the reimbursement appears as a separate settlement line item. If your accounting system doesn’t capture it, your effective COGS for that SKU is overstated, and your margin analysis is wrong. Beanhawk catches those gaps continuously, not just at year-end.
Integration note: Beanhawk connects to Amazon Seller Central, QuickBooks, and Xero. Settlement data flows directly into your accounting system with the correct SKU-level attribution, which means your monthly SKU model starts from clean, reconciled numbers rather than manually patched exports.
Auditability: Every reimbursement claim and settlement posting carries a full audit trail, so your SKU profitability numbers can be traced back to source documents. That matters when your accountant or a tax preparer needs to verify COGS.
Understanding FBA reimbursements and how they affect your cost basis is one of the fastest ways to recover margin that’s already been earned but not yet recorded.
How customer lifetime value changes the SKU profitability equation
A SKU that loses $2 per first-order unit can still be a rational investment if it reliably converts buyers into repeat purchasers of higher-margin products. This is the customer lifetime value (CLV) adjustment to SKU-level analysis, and it’s most relevant for consumables, subscription-adjacent products, and brand-building SKUs.
The practical approach is to segment SKUs by repeat purchase behavior. That changes the delist decision entirely.
The discipline is to make this adjustment explicit and bounded. Assign a CLV uplift only when you have actual cohort data showing the repeat purchase pattern, not a theoretical assumption. And cap the uplift at a defensible number: if SKU A loses $3 per unit but the CLV uplift from downstream purchases is $8 per acquired customer, the math works. If the uplift is speculative, treat SKU A as a loss and investigate whether the repeat purchase pattern is real.
For most Amazon sellers, CLV adjustments are most relevant for private-label consumables (supplements, beauty, household) where subscription or auto-reorder rates are measurable. For one-time-purchase categories, CLV rarely changes the SKU-level decision.
Setting profitability benchmarks and targets by SKU category
Benchmarks give your scoring matrix context.
General benchmark ranges by category type (use as starting points, not hard rules):
- Commodity / highly competitive SKUs: Target contribution margin of 15,20% before advertising. Below 15%, there’s almost no room to run profitable ads.
- Differentiated private-label SKUs: Target 25,35% contribution margin before advertising. This range supports meaningful ad spend and still leaves net profit.
- High-return-rate categories (apparel, footwear, electronics): Add 8,15 percentage points to your minimum contribution margin target to absorb return costs.
- Oversized / heavy items: Add 5,10 percentage points to account for dimensional-weight shipping and higher FBA fees.
How to set internal targets: Start with your actual cost stack for a representative SKU in each category. Calculate the minimum contribution margin needed to cover your target CPA at your historical conversion rate. That floor is your minimum viable margin for that category. Set your “Maintain” threshold 5 percentage points above the floor and your “Hero” threshold 10 points above.
Profitability benchmarking across your catalog is most useful when done by product line rather than by individual SKU. The line average masks the outliers; SKU-level analysis surfaces them.
Review benchmarks quarterly. Fee changes (Amazon adjusts FBA fees periodically), supplier price movements, and competitive pricing shifts all move the floor. A benchmark set in Q1 may be wrong by Q3 if any of those inputs changed.
How to account for seasonality and demand variability in your analysis
Running a SKU profitability model on a single month’s data during peak season will make your catalog look more profitable than it is. Running it during a slow month will make it look worse. Seasonality and demand variability need to be built into the model, not treated as noise.
Three practical approaches:
Trailing 12-month average: For most SKUs, a 12-month trailing average smooths seasonal peaks and troughs and gives you a representative annual contribution figure. This is the right basis for strategic decisions like delisting or supplier renegotiation.
Season-specific models: For SKUs with strong seasonal patterns (holiday gifts, summer outdoor products, back-to-school items), build separate profitability models for peak and off-peak periods. A SKU that generates $40,000 in contribution in Q4 but loses $5,000 in Q1,Q3 is still a net positive, but the Q1,Q3 loss needs a cash plan.
Demand variability adjustments: High-volatility SKUs (coefficient of variation above 0.5 in monthly unit sales) carry higher inventory risk. Build a carrying cost buffer into their allocated storage cost to reflect the higher average inventory position needed to maintain service levels. A SKU that sells 500 units in one month and 50 the next requires more safety stock than one selling 250 units consistently.
Storage cost timing: FBA long-term storage fees spike for inventory held past 365 days. If a seasonal SKU sits in FBA between seasons, those fees can erase the contribution earned during peak. Model storage costs monthly, not as an annual average, for any SKU with a seasonal demand pattern.
What most SKU profitability guides get wrong
The standard advice is to calculate contribution margin and rank your SKUs. That’s correct as far as it goes. What most guides skip is the part where the model breaks down in practice.
The first failure point is returns. Most sellers either ignore return costs entirely or apply a catalog-average return rate to every SKU. Neither is right.
The second failure point is advertising. Sellers often look at ACoS as a media metric and contribution margin as a product metric, treating them as separate conversations. They’re not. The PAG metric exists precisely to force that conversation into a single number.
The third failure point is timing. Sellers run a SKU analysis once, find a few losers, make some changes, and then don’t run it again for six months. Fee changes, supplier price increases, and competitive repricing can flip a profitable SKU into a loser in 60 days. Monthly cadence isn’t bureaucracy; it’s the minimum frequency at which the analysis stays accurate enough to trust.
The quick wins that consistently recover margin: correct your return reserves to be SKU-specific, stop advertising on any SKU with a negative PAG, and check your FBA reimbursements. That last one is often the most surprising. Sellers running their first reimbursement audit regularly find months of unclaimed recoveries sitting in their settlement history.
The 30/60/90 timeline that works in practice: spend the first 30 days getting the model right for your top 20 SKUs. Spend days 30,60 expanding to the full catalog and making your first round of ad-spend and pricing decisions. Spend days 60,90 embedding the monthly cadence, automating data pulls where possible, and setting up the governance process so the model runs without heroic effort.
Beanhawk gives you clean numbers before the analysis starts
The hardest part of SKU profitability analysis isn’t the math. It’s getting accurate inputs. FBA reimbursements that never get claimed, settlement fees that don’t match your accounting records, and landed costs that aren’t tracked at the SKU level all produce a model that looks rigorous but is built on wrong numbers.
Beanhawk solves the input problem. It monitors your FBA ledger continuously, catches lost and damaged inventory before it disappears from your books, and automates the reimbursement claim process so recoverable amounts actually show up in your P&L. Settlements post directly to QuickBooks or Xero with SKU-level attribution, which means your contribution margin calculations start from reconciled data, not manually assembled exports.
The free audit takes 60 seconds to start and shows you what Amazon currently owes you across your FBA inventory. From there, Beanhawk’s subscription handles ongoing monitoring, settlement posting, and COGS tracking so your monthly SKU model runs on numbers you can trust. Find out what Amazon owes you and start your free audit at Beanhawk.
Sources
- SKU-Level Profitability: The Complete Guide for…
- Ecommerce SKU Profitability Analysis: Accountant Guide
- Know your true margins with SKU-level profitability
- Peak